

The first report card is in
The College Sports Commission published the results from year one of the House settlement's revenue-sharing program. Of the 319 schools that opted in, 307 distributed a combined $1.77 billion to 34,915 student-athletes across 45 sports and 33 conferences. Sixty-three schools hit the $20.5 million cap exactly. Five more came within five percent. The identities of those 68 schools were redacted by the CSC. You do not need the list to know who they are.
The cap for 2026-27 is $21.58 million. The numbers families are hearing this fall are higher than anything that was on the table a year ago.
When all the top programs spend to the ceiling, the question changes
For families in active recruiting conversations, the instinct is to treat revenue share as a negotiating point: ask how much, then compare that number across programs. That instinct is reasonable. The year-one data complicates the math.
When 68 programs, the full footprint of the Power Four, all hit or nearly hit the same ceiling, total spend stops being a differentiator between those schools. They are each spending approximately the same amount.
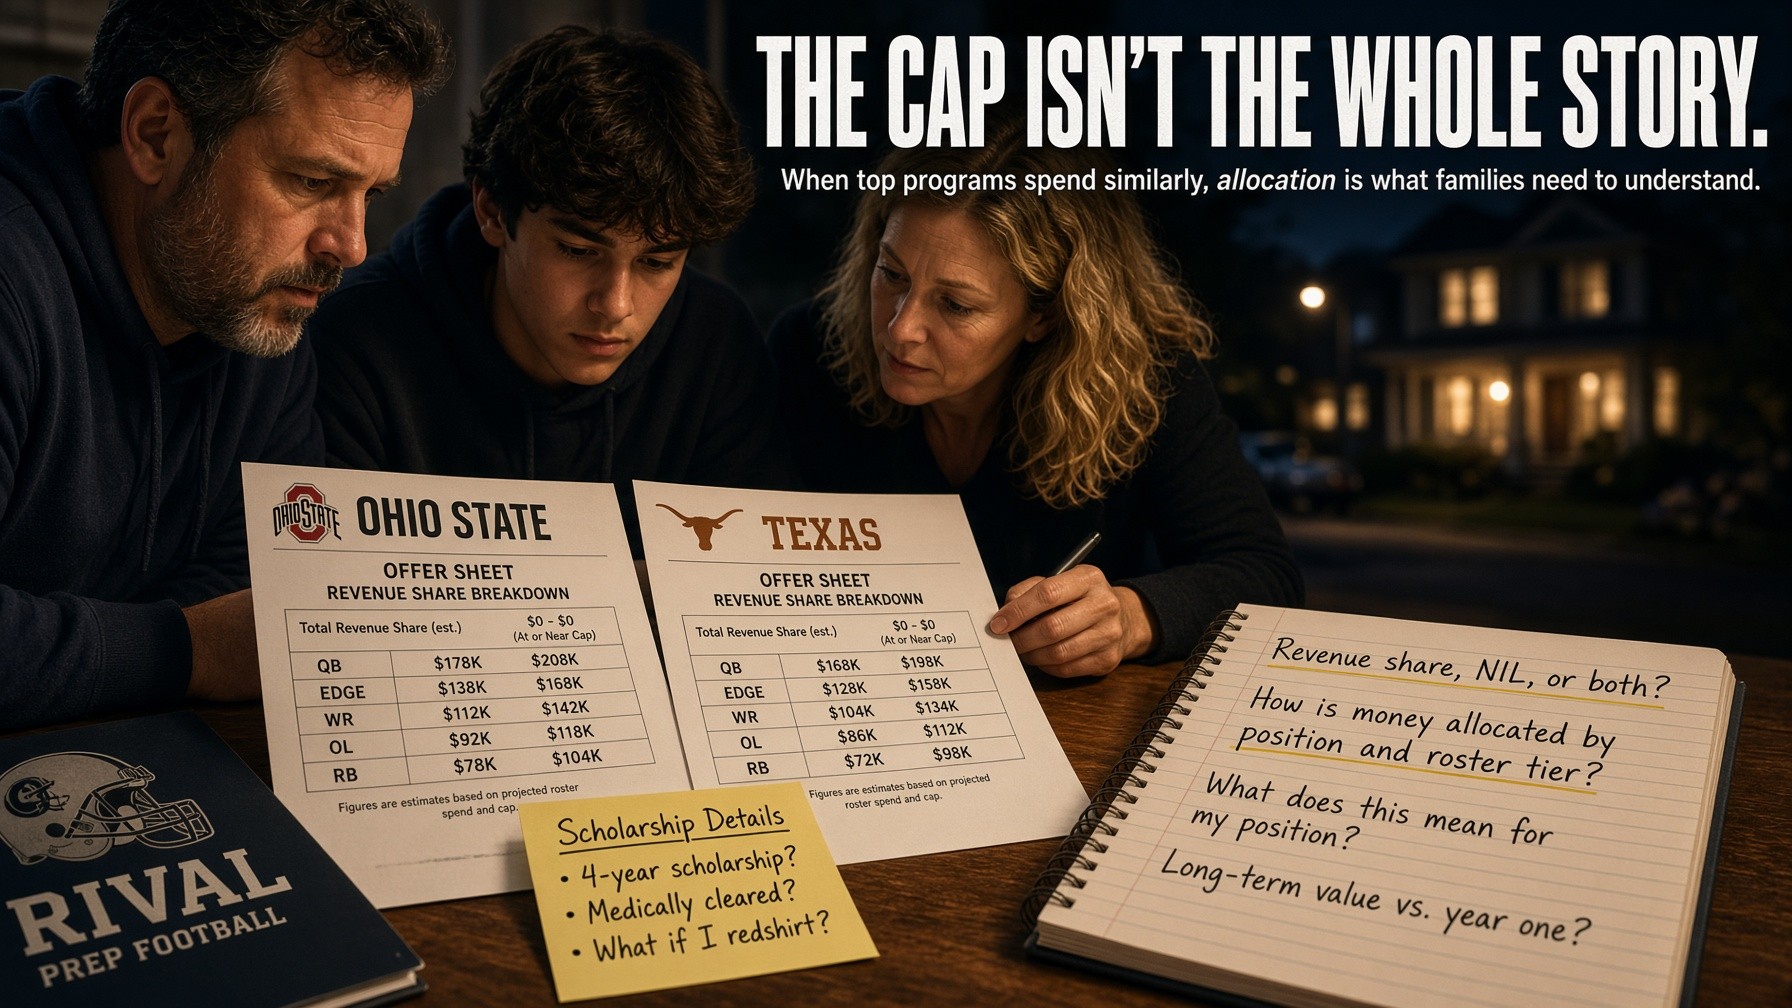
What differs is allocation: how a program distributes its budget across sports, positions, and roster tiers. Those decisions are made internally, are rarely disclosed, and are not captured in the CSC's aggregate data. A program at the cap might concentrate the bulk of its $21.58 million on its most visible revenue sports, leaving significantly less for other positions.
Families evaluating a revenue-share offer should ask the follow-on question: where does this program allocate within its cap, and what does that mean specifically for an athlete at my son's position?
What the lower end of the distribution tells you
The variation across all 307 participating schools is substantial. Fourteen schools distributed under $100,000. The minimum was $15,000. Ten schools spent nothing on direct revenue sharing, though some increased scholarship spending through other mechanisms.
For families evaluating offers at schools outside the power conferences, this context matters. An FCS program, a Group of Five school, or a mid-major can still offer a meaningful path and a strong fit. But the financial structure of the offer will look different, and understanding that difference is part of evaluating it clearly, not a reason to dismiss it.
Three questions worth asking this fall
For families in active fall recruiting conversations, three questions are worth raising when revenue share comes up:
- Is the program at the cap, near it, or well below it?
- How is the allocation structured across sports and positions within the program?
- Is the number being discussed a revenue-share allocation, a NIL number, or a combination of both?
None of those questions have guaranteed answers. Coaches are not obligated to disclose allocation details, and programs have every incentive to present their offer in the most favorable light. But asking them shifts a family from reacting to a headline number toward understanding what the offer actually represents. That is a more useful place to be.